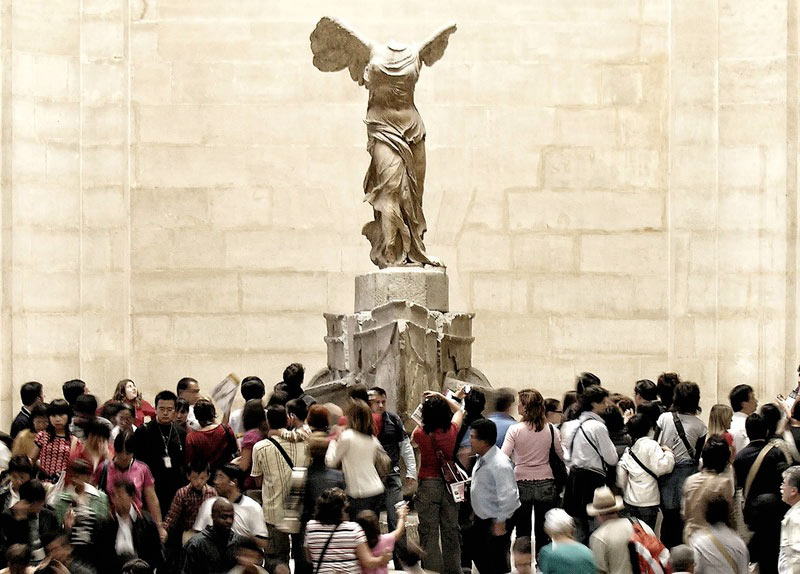
France. Culture in general and museums in particular are not the sectors emitting the most CO2, however their carbon footprint is not neutral, both in terms of emissions and on a symbolic level. The Ministry of Culture estimates (a little with a wet finger!) that culture emits 12 million tonnes of CO2 eq per year, excluding transport and audiovisual, or between 2 and 3% of total emissions in France, a figure comparable to economic weight of Culture in GDP. More precise figures exist by location or type of event. A large city festival emits on average around 28,000 tonnes of CO2 eq and a performance hall on the outskirts produces 1,500 tonnes of CO2 eq per year, according to the report “Decarbonise culture! », published by The Shift Project in 2021. The Louvre alone generates 4 million tonnes of CO2 eq per year while the Palais de Tokyo emits around 7,000 tonnes. Let us note now, however, that a very large majority of greenhouse gases (GHG) emitted by cultural places come from the transport used by visitors to come to the place, which explains the considerable carbon footprint of the Louvre and its 9 million visitors.
The Bilan Carbone methodology, developed by the Environment and Energy Management Agency (Ademe) is the most well-known and widespread calculation tool. It makes it possible to evaluate the quantity of GHG emissions linked to a product, a process or an organization over a specific period of time. Contrary to what its name suggests, the carbon footprint does not only take into account carbon dioxide (or CO2). It also counts five other GHGs: methane, nitrous oxide, hydrofluorocarbon, perfluorocarbon and sulfur hexafluoride. To simplify their calculation and be able to combine their impact, all these gases are reduced to the CO2 scale by being converted into carbon equivalent. When a museum carries out its carbon footprint, the result is therefore expressed in tonnes of CO2 equivalent (CO2 eq). All the flows on which its activity depends are taken into account, generally over a period of one year, which allows it to identify its most polluting positions and to have an overall overview of the levers to be used to reduce its carbon footprint.
Three categories of GHG emissions
GHG emissions linked to the activities of a structure are classified into three categories called “scopes” (“perimeters” in French). Scope 1 brings together all emissions directly generated by a structure or community, that is to say those linked to the combustion of fossil fuels. This includes both emissions from vehicles in its possession and those generated by the operation of a gas boiler on the premises. For many museums, this category has little weight in the carbon footprint: only 54 tonnes of CO2 eq for the Orsay and Orangerie Museums in 2019 (less than 1% of their overall carbon footprint) for example. For others, the impact is more significant: 2,000 tonnes of CO2 eq (14%) for the Réunion des musées nationaux-Grand Palais (Rmn-GP) in 2016.
Scope 2 includes all indirect emissions linked to energy consumption, which are therefore not directly generated on the site of the structure. They are associated with the production of electricity, steam, heat or cold. The weight of energy consumption varies greatly depending on the museum, while their carbon footprint is lower than in other countries due to the nuclear origin of a large part of the electricity in France. At Universcience (Palais de la Découverte and Cité des Sciences et de l’Industrie), energy represents the third largest consumption item (1,891 tonnes of CO2 eq in 2019, or 2% of its overall carbon footprint). For the Palais de Tokyo, this is the fourth item (430 tonnes of CO2 eq in 2021).
Scope 3 brings together all other indirect GHG emissions, therefore everything that does not fall under the first two scopes. This category is the most important but also the most complex to calculate for a museum. It includes the vast majority of emissions resulting from its annual activity, both upstream and downstream. This therefore includes those generated by the products and services purchased (equipment, services, consumable goods, production equipment, etc.), the travel of agents and visitors, the transport of goods (including that of works), digital technology (site Internet, newsletters, social networks) or even waste treatment. Depending on the museums, all these flows weigh more or less heavily on the carbon footprint. The “purchases” item generally has a strong impact: for example, 17,200 tonnes of CO2 eq for the Paris Natural History Museum in 2016 (out of 25,000 tonnes in total, excluding public mobility). By comparison, waste treatment weighs little, varying on average between 0.5 and 5% of a museum’s carbon footprint.
The considerable weight of transporting visitors
For most museums, one source of emissions clearly supplants all others: that of the travel of visitors to come to the museum. In its inspiration and orientation guide published in December 2023, the Ministry of Culture recalls that public mobility accounts, on average, for 65 to 90% of GHG emissions from cultural structures. The more a museum is frequented by international visitors who come by plane or by visitors using a carbon-intensive mode of transport such as the car, the heavier its carbon footprint. In the case of the Louvre, 99% of its carbon impact is attributed to visitor movement. For the Musée d’Orsay and the Musée de l’Orangerie, this trip generated 116,000 tonnes of CO2 eq in 2019, which represents 92% of their overall carbon footprint. In Geneva, the Museum of Ethnography (MEG) produced 891 tonnes of CO2 eq in 2022, of which 59% attributed to the transport of visitors, who mainly come from the region.
“The weight of public mobility depends on the typology of the structure, explains Laurence Perrillat, co-founder of the Les Augures collective which supports actors in the cultural world in their ecological transition. A cultural establishment in a large metropolis, whose visitors mainly travel by public transport, may have lower public-related emissions than those of an establishment in a rural area, which attracts regional tourists traveling by car. » An observation that is verified in the case of art centers. After studying a panel of five different types: La Criée in Rennes, the Center for Contemporary Creation Olivier Debré (CCCOD) in Tours, the Crédac d’Ivry, the Maison des arts Georges et Claude Pompidou (Cajarc) and the International Center of art and landscape of Vassivière Island (CIAPV) in New Aquitaine. “ For these five art centers, which produce on average 400 tonnes of CO2eq per year, the weight of visitors varies between 20% and 80% of their overall carbon footprint., assesses Laurence Perrillat. Thus, unless non-local visitors are prohibited, museums have very limited room for maneuver to reduce the carbon footprint of visitors and consequently their carbon footprint in general. Some places offer reduced tickets to those who come on foot or by bike, but this is more symbolic.
Calculating the carbon footprint
As the Bilan Carbone methodology is protected, it is necessary to go through an approved depositary. Today, most cultural establishments of a certain size have among their teams CSR (organizational social responsibility) managers, responsible for the ecological transition of the establishment. Others seek advice from external partners specializing in the field such as Les Augures, Solinnen or Art of Change 21.
Data collection is carried out by engineers specialized in calculating the carbon footprint. “ We start by raising the institution’s awareness of climate/energy issues with a view to involving as many stakeholders as possible in the process, explains Carole Rapilly, engineer and founding CEO of the TranSyLience firm. Next comes a data collection phase, which generally lasts one to six months depending on the structure. » A tedious step since some activity data is more difficult to retrieve than others. While some are known precisely, such as energy consumption or liters of fuel, others are estimated or extrapolated from the results of a survey.
The most complex case is that of the carbon footprint of visitors. You must first calculate the share of local, national and international visitors. A calculation which tends to be more and more simple because a visitor who buys his ticket is often asked to indicate the postal code of his place of residence. Next, it is necessary to record the means of transport used by the visitor to come from their place of residence to the museum, then estimate the time allocated to the specific visit to the museum during the tourist’s entire stay. Not easy. Some places turn to the local tourist office to estimate its figures, others opt for a more time-consuming study of public mobility, which consists of questioning a panel of visitors over a specific period about their average journey traveled. of locomotion used, reason for visit, etc., then extrapolate this data to the full year.
Once all this data has been collected, the step of converting it into the quantity of GHG emissions occurs. Since it is rarely possible to directly measure the emissions generated by an activity, a calculation must be made: each activity data is multiplied by an emissions factor. Regularly updated, these factors are provided by databases. The most used is the Empreinte Base of the Environment and Energy Management Agency (Ademe) although there are many other more or less general ones (Ecoinvent, Exiobase, etc.). For example, for a passenger on a long-haul flight, the factor is estimated at 0.152 kg of CO2 eq emitted per kilometer traveled, according to the Footprint Base.
What can we learn from the carbon footprint of museums? On the one hand that the latter do not have control over a very large part of their GHG emissions and on the other hand that the calculations still remain very approximate. But this should not prevent museums from contributing to reducing these emissions.


